The data-driven academic landscape brings a real challenge for researchers.
How to analyze the data?
For this, it is important to first understand the types of data analysis.
In this blog, we will discuss five 5 types of data analysis as shown in the figure below.
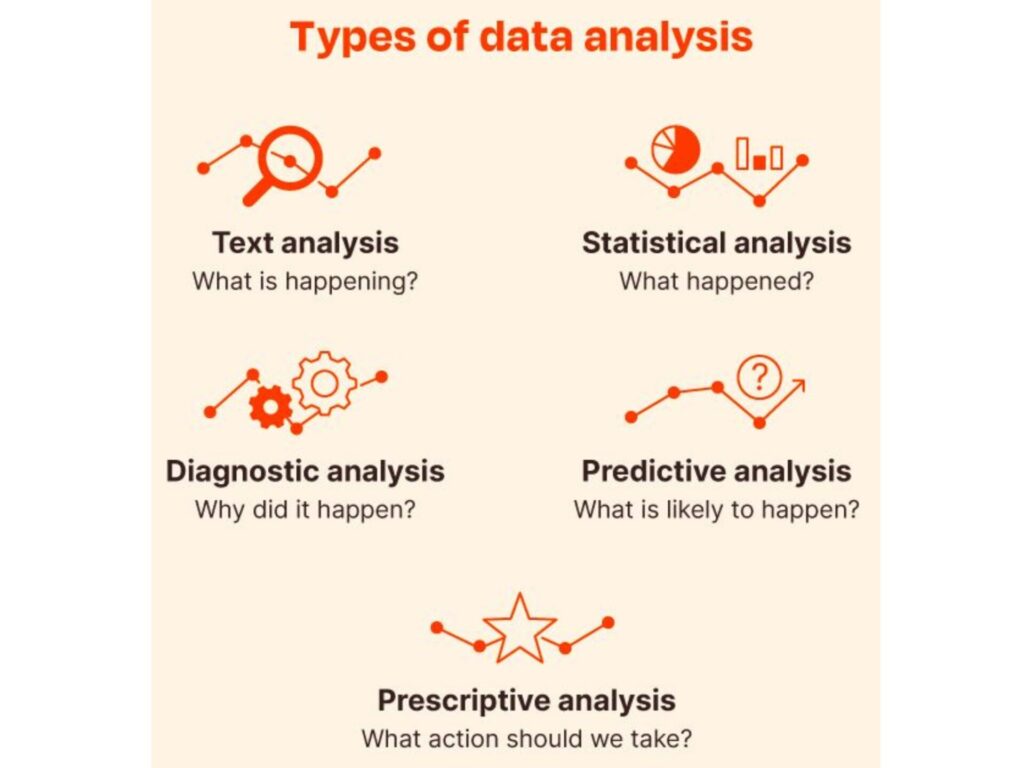
1. Text Analysis
Text analysis is a process of extracting meaningful information from unstructured textual data by using techniques of statistical analysis, natural language process and machine learning.
➝ Extracts and categorizes information from textual data.
➝ Identifies patterns, sentiments, and trends in text.
➝ Used for natural language processing and content analysis.
When to Use?
Researchers should try text analysis when data is unstructured and in textual forms. For example, you can identify frequently mentioned topics in feedback and can perform qualitative analysis on research data.
Benefits:
- It helps researchers extract trends, sentiments and themes from interviews and surveys.
- It lets researchers manage the analysis of large volumes of textual data that is impractical otherwise.
- It allows you to understand natural language, such as public opinion, brand perception, behavior patterns, etc.
Types of Text Analysis
1.1. Linguistic Analysis
Linguistic analysis is mainly used to reveal grammatical errors. Still, it now uses advanced statistical techniques and natural language progression methods, such as the speech technique, to ensure that sentences are well-connected and that the content is meaningful.
1.2. Quantitative Text Analysis
Quantitative text analysis creates either grammatical or definitive equations between words to ensure that you make proper conclusions about the text and author.
1.3. Contextual Analysis
Contextual analysis makes it easy for researchers to analyze text based on cultural, historical, social and other factors.
1.4. Named Entity Disambiguation (NED)
It lets you clear the concept from the content through entity linking.
1.5. Text Classification
You can use classic text data using techniques such as SVM, neural networks, or Naive Bayes. When it comes to labelling, spam detection, or sentiment analysis, text classification works best.
1.6. Sentiment Analysis
You need to identify the emotional tone of the text. For example, this tone can be positive, negative or neutral. When it comes to analyzing product reviews, social media monitoring and customer feedback, sentiment analysis is the best option.
1.7. Topic Modeling
It helps researchers identify abstract topics from a set of documents by using techniques such as latent Dirichlet Allocation (LDA) and non-negative matrix factorization (NMF). When you need to pinpoint a theme in customer feedback, reviews or articles, this data analysis method comes to the rescue.
1.8. Text Summarization
Text summarization types allow you to generate a summary while retaining the main idea. You can try an extractive or abstractive method for text summarization. It’s a useful technique to apply for news summaries and document briefings.
1.9. Named Entity Recognition (NER)
When you need to perform an analysis of legal documents and news categories, you can use NER, where you identify proper nouns.
1.10. Text Clustering
You will create a group of similar text without any labelling by using techniques of hierarchical clustering and K-means. Whenever you need to do market segmentation, text clustering seems like the best method to use.
Do you want to identify OPEN ACCESS articles for your literature review?
If yes, try SciSummary.
It will identify open access articles that you can download for free.
What’s more interesting? You can get premium access to SciSummary for 100% FREE.
➟ Sign into www.scisummary.com
➞ Use code FAHEEM at the checkout.
➞ You will get 100% free access to SciSummary for 1 month.
Check it out here: www.scisummary.com
2. Statistical Analysis
Statistical analysis is a process where a large amount of data is collected and analyzed for valuable insight and trend identification.
➝ Involves the collection, analysis, and interpretation of data.
➝ Uses statistical methods to test hypotheses and make inferences.
➝ Supports decision-making through quantitative data assessment.
When to Use?
Researchers can use this type of data analysis to explore the relationship between variables, summarize numerical data and validate hypotheses. For example, testing the significance of your research findings and performing analysis on survey results.
Benefits:
- It makes it easy for researchers to validate hypotheses through testing and correlations.
- It lets you draw evidence-based conclusions via the identification of variations, distributions and trends.
- It allows you to make your findings easy to compare and more credible.
Types of Statistical Analysis
2.1. Descriptive Analysis
Descriptive statistics analysis provides the summary of all the information within a data set, but it doesn’t provide any final thoughts about its content.
2.2. Inferential Analysis
Inferential statistical analysis is the next step of descriptive statistics as it helps researchers draw conclusions based on the data they get and then recommend the best course of action.
Here is how you can prepare a research-focused CV:
- Provide a detailed education history; also include minor subjects that are relevant to your research field.
- Brag a little about your academic achievements, such as scholarships, fellowships, grants or fellowships. Add details of research certifications and licenses to showcase your expertise in a particular field.
- Must write about teaching experience that demonstrates your ability to understand former and current theories and data. Always provide details of your scholarly work, such as theses, presentations, dissertations, etc.
- Provide a bulleted list of research-relevant skills such as report writing, data analysis, interviews, primary and secondary research, data collection, etc.
- In the additional section, you can mention publications, memberships, volunteer work and professional experience (outside academia)
3. Diagnostic Analysis
Diagnostic analysis is a process of investigating and understanding the root causes of outcomes and past events.
➝ Examines data to determine the cause of a problem.
➝ Analyzes historical data to identify patterns and relationships.
➝ Provides insights into why certain events or outcomes occurred.
When to Use?
Use when something happens unexpectedly, and you need to understand why it happened. For example, understanding the cause of anomalies in research results. Tracking back some errors or failures in your data processes.
Benefits:
- It helps you identify the root cause of the outcome and explains why something happened.
- It boosts research depth by adding context to raw data by tracing unusual patterns.
- It guides corrective action. Refine models and methodologies for future research.
Types of Diagnostic Analytics
3.1. Hypothesis Testing
This method uses sample data to evaluate how plausible a hypothesis is. Scientists use this test to assess whether observed patterns are relevant statistically or not.
3.2. Anomaly Detection
Diagnostic analytics also help you identify unusual patterns or outliers in data. This technique essentially helps you pinpoint irregularities that might be indicative of problems or potential threats.
3.3. Root cause Analysis
This type of diagnostic analysis makes it easy for you to highlight root causes to determine solutions. It starts by identifying the origin of the problem through data analysis and then continues with learning the cause of the problem; the last step would be to take steps to fix the problem.
3.4. Correlation
This type of diagnostic analytics makes it easy for researchers to understand the relation between variables. Analysis is put into practice by assessing all the data to understand true cause-and-effect relationships.
3.5. Diagnostic Regression Analysis
It is a type of diagnostic where you need to determine the relation between a dependent variable and one or more independent variables. Through this analysis, researchers can easily identify the impact of different factors on a specific outcome.
4. Predictive Analysis
Predictive analysis is a process where current and historical data is analyzed to pinpoint common patterns and make some future predictions.
➝ Uses historical data to forecast future events or trends.
➝ Employs machine learning and statistical models to predict outcomes.
➝ Helps identify potential risks and opportunities.
When to Use?
Researchers can use this type of data analysis to forecast outcomes, behaviors and trends based on historical data. For example, you can anticipate risk factors of a certain scenario or forecast health trends or market demands.
Benefits:
- It helps forecast results, future trends, and outcomes.
- It lets research timely action based on future conditions
- It helps you refine hypotheses.
Types of Predictive Analysis
4.1. Regression analysis
Regression analysis helps researchers understand the relationship between a dependent variable and one or more independent variables.
4.2. Decision trees
Decision trees utilize data-mining algorithms to create a tree diagram that showcases the decision-making process. The branches of a tree showcase an idea, while leaves from branches demonstrate the outcome segment.
4.3. Clustering
Clustering allows you to examine data by breaking it into different segments for a detailed analysis. You create a group based on typical data characteristics and inherent patterns.
Classification models
Classic models classify data based on specified classed or defined patterns. A binary model showcases results in YES or NO form, while a multi-class provides results in small, medium or large form.
4.4. Time series forecasting
Time series forecasting helps researchers identify connections and patterns between data collection at different time intervals. This helps you examine a situation at various time intervals, so forecasting based on this interpretation is accurate and not misleading.
5. Prescriptive Analysis
Prescriptive analysis is a process during which previous data is analyzed to get some insights and determine the course of action that companies can take to become ready for predicted trends.
➝ Recommend actions based on data analysis.
➝ Combines predictive models with optimization techniques.
➝ Aims to suggest the best course of action for desired outcomes.
When to Use?
You can use this type of data analysis to improve your decision-making process with recommended actions or strategies. For example, recommending some policy interventions or improving the educational system.
Benefits:
- It recommends actionable steps you can take to get the desired outcome
- It boosts decision efficiency and saves time by highlighting the best options.
- It makes it easy for you to perform scenario testing before the strategy is implemented in the real world.
Types of Prescriptive Data Analysis
5.1. Optimization Analysis
Optimization analysis makes it easy for researchers to determine the best actionable steps under given constraints by using techniques of linear programming, genetic algorithms, and integer programming. It is commonly used for workforce scheduling, supply chain management and resource allocation.
5.2. Simulation Analysis
Simulation analysis tests different scenarios by using techniques of either Monte Carlo simulation or Discrete event simulation. It is mainly used for inventory planning, demand forecasting in uncertain scenarios, and risk management.
5.3. Decision Analysis
Decision analysis evaluates different decision paths through three common techniques such as cost-benefit analysis, influence diagrams, and decision trees. Decision analysis is mainly used for medical treatment planning, investment decisions and strategy planning.
5.4. Heuristic Models
Heuristic models allow quick decision-making by using techniques of rule engines and business logic frameworks. It is used mainly for fraud detection, lead qualification, and marketing campaign rules.
5.5. Recommendation Systems
Recommended systems suggest actions and products based on reference and behaviour patterns of users. The whole system is based on three content-based filtering, collaborative filtering, and hybrid systems. This type of data analysis is used for content personalization, cross-selling, upselling, and ecommerce product recommendations.
5.6.Machine Learning for Prescriptive Models
The machine learning type lets you recommend action based on the pattern of a large dataset. It utilizes techniques such as causal inference models, prescriptive analytic platforms and reinforcement learning for this purpose. Commonly, machine learning techniques are used for autonomous vehicles, dynamic piercing, and healthcare treatment suggestions.
Source: What is data analysis? Examples and how to get started by Shea Stevens, 2023
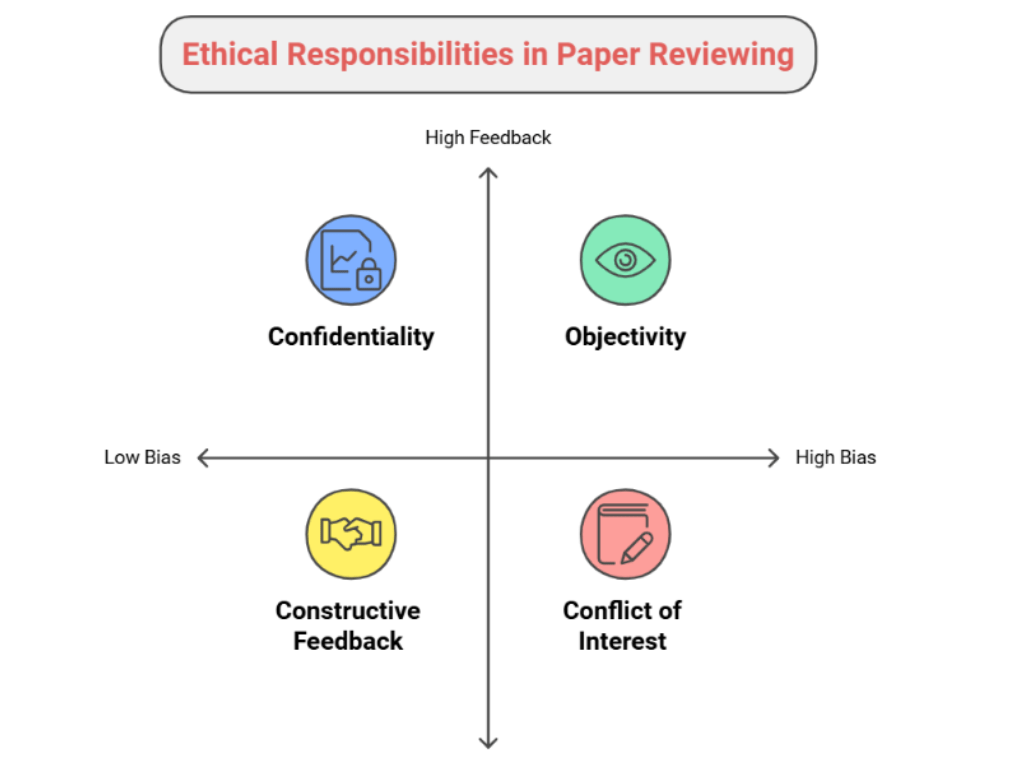
Don’t forget to read: How to Review a Research Paper?
YouTube Channel: www.youtube.com/@DrFaheemUllah

Find me on Instagram